
In the Research and Development Department, studies regarding the impact of the carried low-temperature cargo on the temperature distribution within the hull structural elements were carried out. Currently, LNG (liquified natural gas) is most commonly transported by ships, specially designed for the purpose. Additionally, LNG is becoming more and more popular as an alternative fuel compared to typical heavy fuels, mostly due to the lower carbon dioxide emission. Therefore, the tanks for LNG are mounted more and more frequently in other ship types (mainly Ro-Pax).
The LNG takes a liquified form at a very low temperature of approx. -163 ⁰C. It could trigger various problems related to the ship’s hull structural integrity. Although the insulation between the cargo and hull structure is applied, the ship’s hull is still subject to low temperatures. In such situations, conventional hull structural steel may become brittle, increasing its susceptibility to cracking. Additionally, the low temperature causes the shrinking of the steel elements, which could induce the high-stress level in the structure. The solution to that problem is to apply – in regions of low temperature in the hull structure – other grades of steel, with a low temperature of transition to a brittle state and low thermal expansion coefficient.
During the structural design process of LNG ships, the temperature distribution within the hull should be estimated to choose the steel grade properly. One of the methods is to perform analytical computations. However, such calculations can be quite complicated in the case of multiple structural elements surrounding the LNG tanks. Therefore, an alternative method will employ numerical simulations using the Finite Element Method. As part of the research and development works carried out in PRS, both methods were used. The results of both methods have been compared.
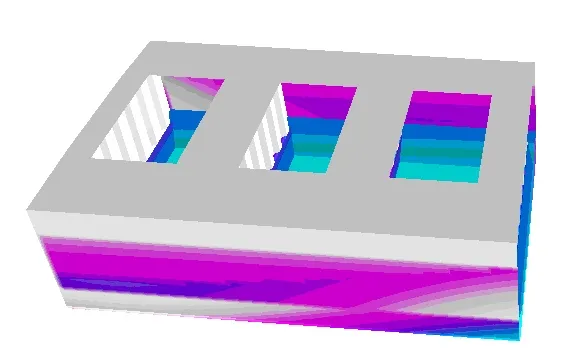
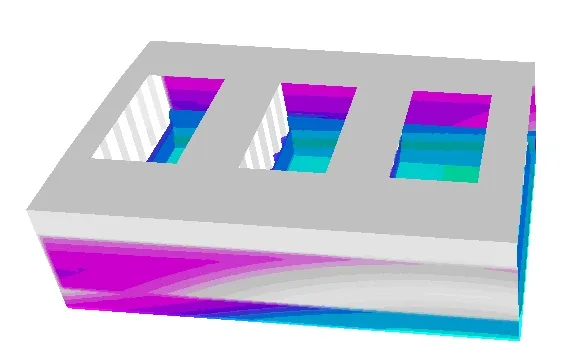
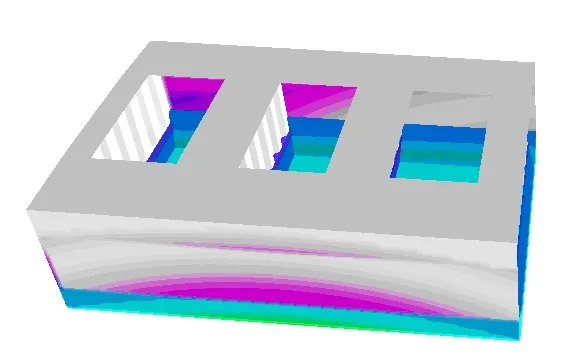
An example of temperature distribution in the region of the double bottom of the typical LNG ship is presented in the Figure below:
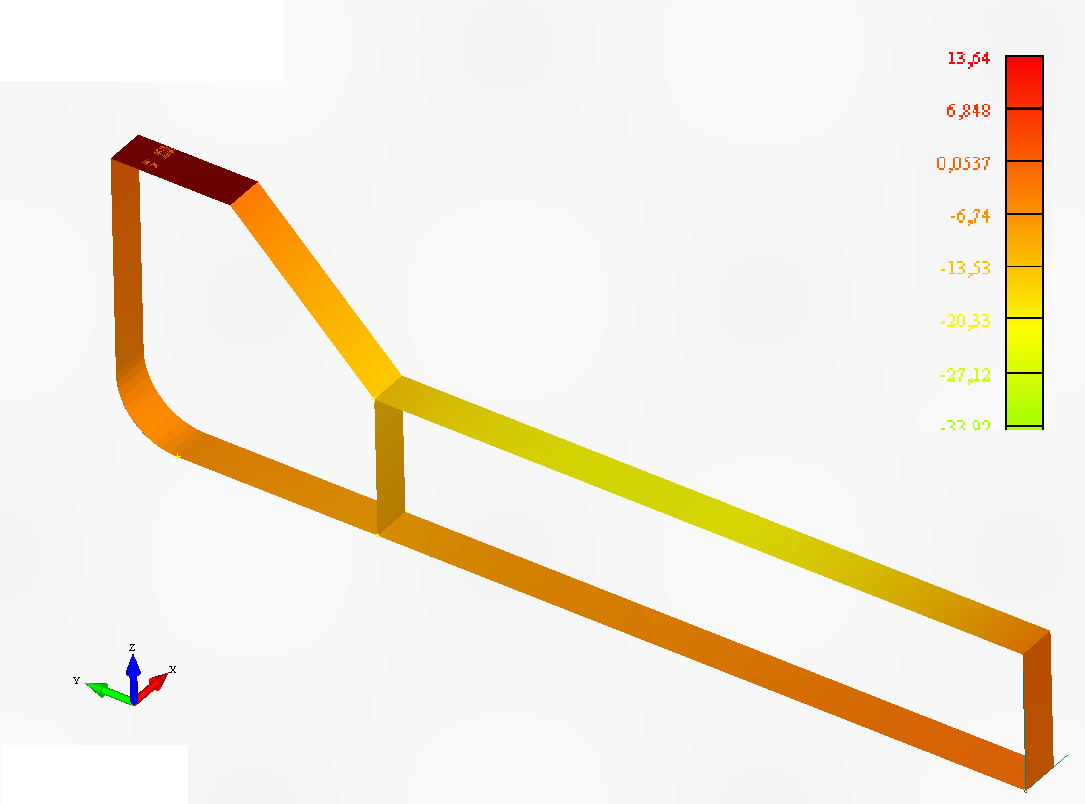
Figure 1. Temperature distribution in the double bottom of LNG ship [⁰C].
The problem of temperature distribution was solved with the assumption that the temperature inside the cargo tank, which is adjacent to the ballast tanks, was equal to -163⁰C. Between the hull structure and tank, an insulation layer was modelled. Two heat transfer mechanisms were included in computations, i.e. convection and conduction [1, 2]. Conduction causes heat transfer inside the steel elements, whereas convection is responsible for the heat transfer inside the ballast tanks. The ballast tanks could be empty or filled with ballast water; in both cases, different thermal properties had to be considered. The thermal properties of steel need to be determined appropriately as well [3]. Where the external hull contacts seawater, the temperature of 0 ⁰C was assumed (acc. to IGC code [4]). The temperature distribution presented in Figure 1 was established based on the computations.
Compared to the analytical method, FE modelling provides results much faster. Additionally, a 3D heat transfer analysis can be carried out (i.e. with consideration of transverse bulkheads).
Based on the carried out works, the guidelines for performing such computations will be developed.
Literature
[1] von Böckh P, Wetzel T. Heat Transfer. Berlin, Heidelberg: Springer Berlin Heidelberg; 2012.
[2] Annaratone D. Engineering Heat Transfer. Berlin, Heidelberg: Springer Berlin Heidelberg; 2010.
[3] Marquardt ED, Le JP, Radebaugh R. Cryogenic Material Properties Database. Cryocoolers 11, Boston, MA: Springer US; 2002, p. 681–7.
[4] International Maritime Organization. International code for the construction and equipment of ships carrying liquefied gases in bulk. London: IMO; 2016.
Calculation models
In the Research and Development Division, research has been carried out on the strength of containership hull subject to torsional loads. Two calculation methods have been analyzed: a method developed in Polski Rejestr Statków based on full-length model of hull and the method conforming to the requirements of Common Structural Rules for bulk carriers and oil tankers, based on three cargo hold model (so called “cargo-hold analysis”).
A mesh of finite elements of the analyzed ship, which has been the basis for models conforming to requirements of both methods, is presented below.
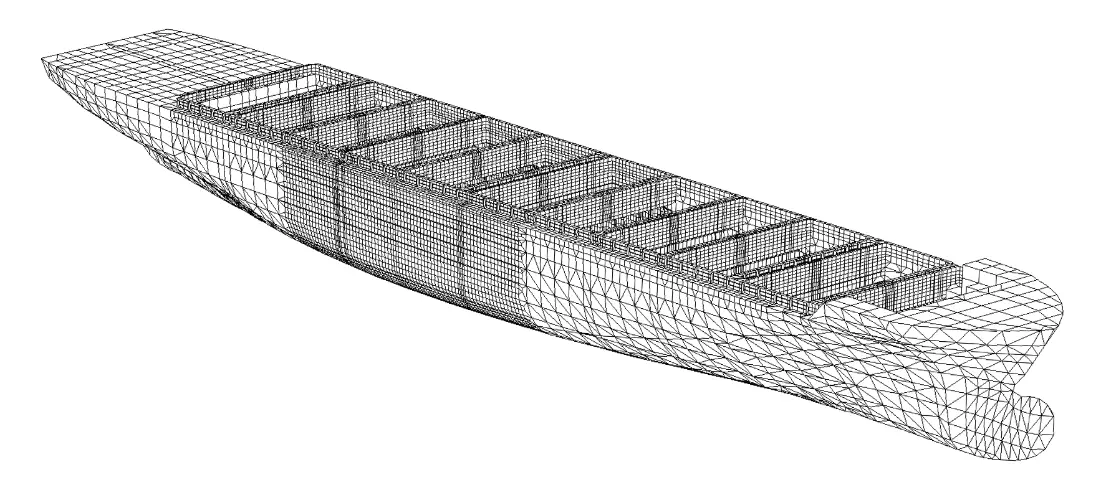
Fig. 1 A mesh of finite elements for a containership
The first of models, conforming to the method developed in the Research and Development Department, is a full-length model where the mesh of finite elements is divided into two regions. In the region of three holds in the midship area, the FE mesh is constructed of plate panels the size of which is equal to the distance between stiffeners, while in the aft and fore parts of hull the element size is equal to the distance between primary supporting members. Additionally, in the midship area, the plating stiffeners are modelled as beam elements. The torsional load is executed by means of constant continuous loads applied to model sides. The model is shown in the below figure.
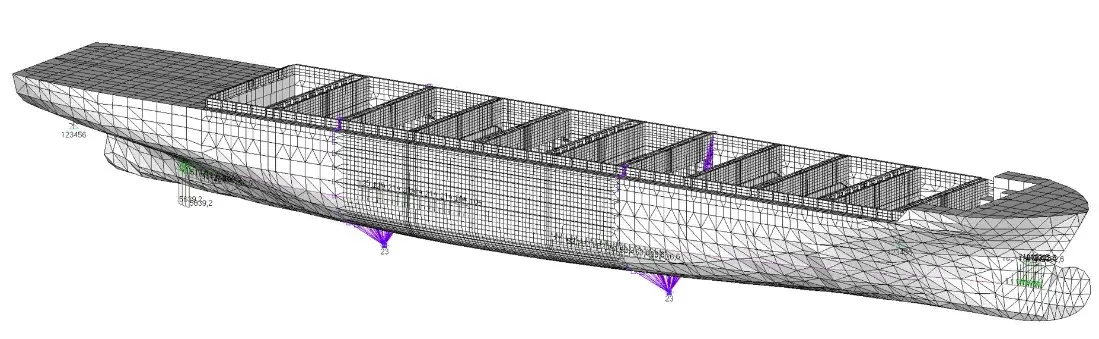
Fig. 2 Model A, based on the PRS developed method
The second model, created based on CSR, is restricted lengthwise to three-hold module in the midship area (the fragment with more dense mesh visible in figure 3). The finite elements mesh is built of plate panels the size of which is equal to the distance between stiffeners and of beam elements representing stiffenings. Stiffness of extreme parts of hull is simulated by so called ‘end-constraint beams’. The model has been loaded with concentrated torsional moment.
Calculation results
The form of deformation of both models, as shown in figures 3 and 4, is consistent with preliminary predictions and reflects the nature of applied torsional load. In both cases, warping effect in model sections is clearly visible, however, it is far more significant in model B.
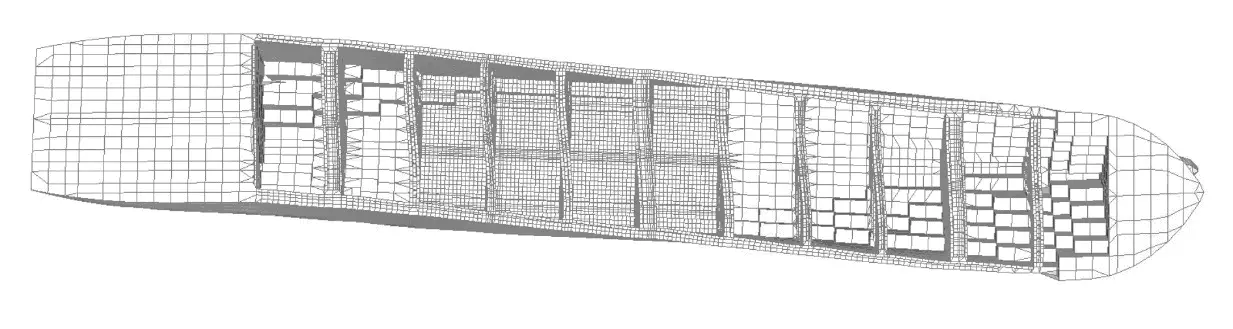
Fig. 3 Deformation of model A
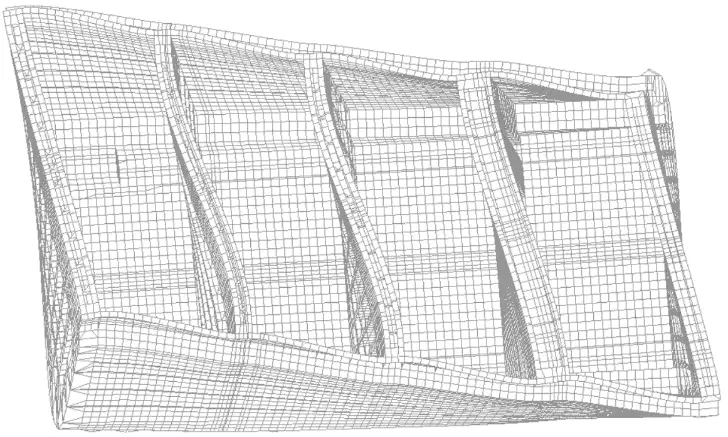
Fig. 4 Deformation of model B
Loads distribution in both models is similar and concentrates in master nodes, such as hatch corners and deck plating in way of cross-deck structure. Considerable differences occur among stress values, which are highly underestimated in model B.
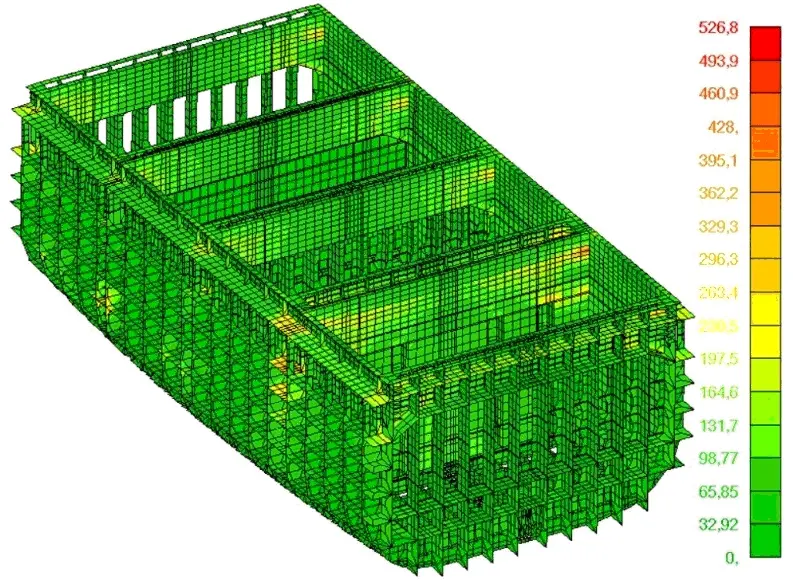
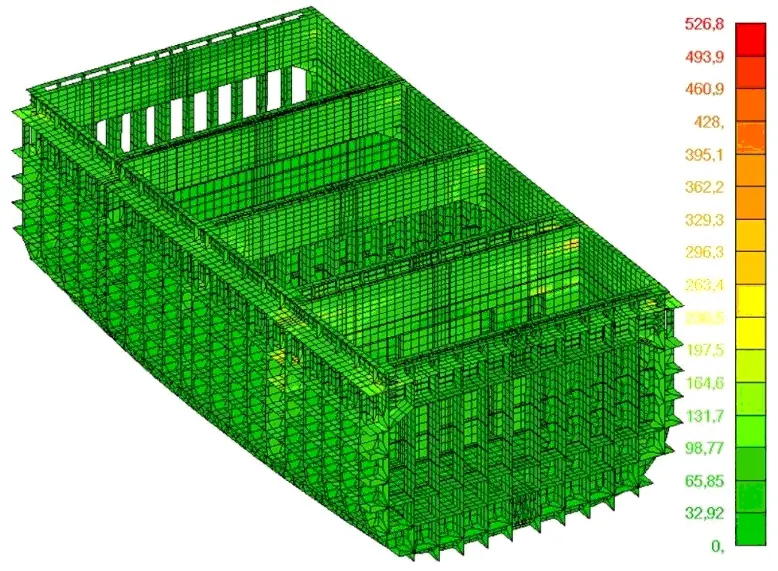
Fig. 5 Equivalent stresses in models A and B, [MPa]
In order to compare both models, maximum stresses in master nodes of strength deck have been combined. Their position is shown in the figure below. Results are given in the below table.
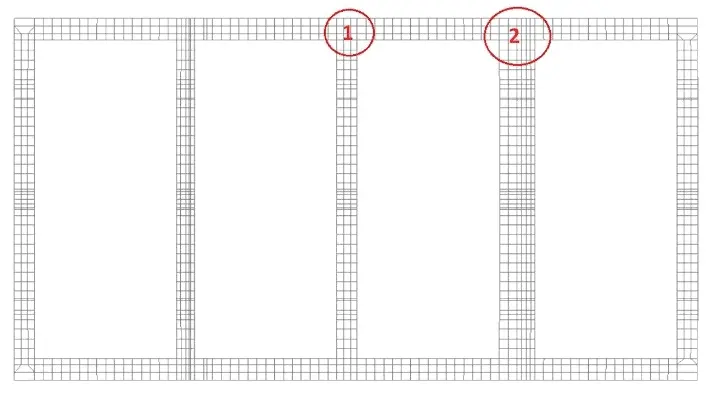
Fig. 6 Position of selected elements
Tab. 1 Maximum stresses in selected deck elements
Region | Stresses [MPa] | Model A | Model B | Δ [%] |
1 | Normal | 60.0 | 44.2 | 26 |
Shear | 120.2 | 79.7 | 34 | |
Equivalent | 208.3 | 138.2 | 34 | |
2 | Normal | 117.1 | 93.2 | 20 |
Shear | 166.6 | 104.7 | 37 | |
Equivalent | 298.7 | 209.3 | 30 |
Performed research proved that the ‘cargo-hold analysis’ approach used in hull strength analysis of bulk carriers and oil tankers does not reflect real response of containership hull structure subject to torsional loads. However, with considerable workload at model execution, the developed in Polski Rejestr Statków full-length analysis method provides reliable and true values of stresses and deformations of containership hull in torsion.
Presentation
Extended version of the above analysis has been presented during MARTECH 2020 conference, held on 16-19 November in Lisbon, Portugal, and will be available in published post-conference papers.
The Research and Development Division of PRS S.A. for years has been conducting works within the scope of developing specialized tools for the performance of stability and strength calculations of floating units. Thanks to them, computer programs intended for internal use of PRS Surveyors are developed and updated.
The WinSea software, used during verification of stability documentation of the units surveyed by PRS, is one of such programs. The WinSea program is currently updated and adapted to the requirements of international, national and PRS rules. The program performs inter alia stability calculations for various loading conditions (including damage condition), general strength, subdivision index (also for ro-pax ships) required by SOLAS Convention.
Based upon experience of surveyors and experts and knowledge of valid regulations and those being implemented, the Polish Register of Shipping continuously diversifies the offer of specialized technical safety improvement software directed to Shipowners, shipyards and universities.
For last years, the Polish Register of Shipping has been developing, at Shipowners request, the StabPRS program, tailored and dedicated to particular floating units. The StabPRS stability and strength software is developed for various types of ships, among others for bulk carriers, general cargo ships, tankers, ro-pax ships. Demo versions of StabPRS software are ordered also by maritime universities, where they are used as educational tools.
The „Silver anchor” prize awarded to PRS during International Maritime Exhibition BaltExpo 2009 is confirmation of the StabPRS software advantages.
An Emergency Response Centre is another PRS’ service linked with the StabPRS program and provided to Shipowners. It involves the execution of emergency appropriate analyzes of the stability and strength (e.g. in case of ship collision or grounding).
The StabPRS program methodology has been also applied in algorithms used in calculation of stability and strength of semi-submersible barges used in docking. At the request of the REMONTOWA Shiprepair Yard S.A. (Gdańska Stocznia “Remontowa” (GSR)), the StabPRS–RemLift program has been developed, which task is to plan safe process of docking the barges of RemLift type. The program enables also stability and strength verification, also for particularly dangerous stages of docking process, such as transfer of the docked object weight (frequently heavy and large-size one) to/from the barge, or support of the barge structure upon the channel basis. Precise process of barge ballasting, ensuring stability of the whole barge–object assembly, is developed. The program has already confirmed its compliance with applicable requirements for several times. It was used, inter alia, at the planning of safe process of docking “Petrobaltic” platform on RemLift barge.
We are proud to mention, that the program brought PRS an award on BaltExpo 2013 Exibition.
Moreover, within the framework of good cooperation, the Polish Register of Shipping developed algorithms of stability and strength calculations for floating docks. The StabPRS program for floating docks enables calculations aimed at ensuring safe operation of a dock in working condition, as well as during its immersing and emerging, with or without an object onboard. The calculations include checking stability and general strength criteria in accordance with the PRS Rules for the Classification and Construction of Floating Docks – Part III – Stability and Freeboard. The StabPRS program enables collecting essential information for the assessment of the docking/undocking process, at its every stage.
The calculation software offered by the Polish Register of Shipping allows for considerably easier and safer performance of operations. It economizes the time for their preparation and minimizes the risk associated with their performance.
Abstract
The Report presents the effect of various subdivision arrangements of ro-pax vessels on the subdivision index. It covers single and double hull sides above car deck with and without buoyancy pontoon of fixed height below the car deck. The width of double sides above car deck read b = 0.2B. Double bottom when not flooded adversely affects damage stability, therefore, calculations were performed solely for damage above the double bottom. The car deck should be of openwork type allowing free flow of air and water. Otherwise the ship is apt to capsize at the initial phase of flooding the inside of the ship. Double sides and double car deck are to improve the subdivision index.
Introduction
Article [1] discusses the effect of various subdivision arrangements of ro-pax vessels on damage stability. Old ferries feature subdivision arrangements presented in Figure 1. with the space below the car deck densely subdivided by transverse bulkheads. Most of these compartments were void, not used for the carriage of any cargo or supplies. There were no double side above the car deck. This type of subdivision arrangement was common to the end of the nineties.
Nowadays, space below the car deck is frequently utilised for carrying ro-ro cargo in the long lower hold (Long Lower Hold – LLH), stretching for about half of the ship length. Below the car deck it has double sides, subdivided by transverse bulkheads, usually terminated at the car deck, and no transverse bulkheads in cargo space. For better safety, the double sides should extend above the car deck; see [2, 3].
The reported study chose a ferry built in 1990 (still in service) as a generic ship with calculations made for a number of modified arrangement configurations.
The ship fulfils the requirements of the IMO resolution A.265 [4], the predecessor of the current harmonised SOLAS [5]. The said resolution does not require reserved buoyancy above the car deck. In the case of a LLH below the car deck, the width of the double sides should be equal to b = 0.2B, while the height of the double bottom should be at least hb = 0.1B. It should be noted that a higher double bottom adversely affects damage stability [1]. In view of damage safety, the height of the double bottom should be as low as possible. The minimum height of the bottom for the ship investigated according to PRS Rules is HB = 1.025 m.
Literature
- Pawłowski M., Laskowski A. Effect of watertight subdivision on damage stability of ro-ro ferries, Trans RINA, Vol. 156, Part A2, Intl J Maritime Eng, Apr–Jun 2014, pp. A-131–136, DOI No: 10.3940/rina.ijme.a2.2014.283.
- Pawłowski M. Subdivision of RO/RO ships for enhanced safety in the damaged condition, Marine Technology, Vol. 36, No. 4, Fall 1999, pp. 194–202.
- RINA, Best Ships of 2001, pp. 46-47.
- International Maritime Organisation: Regulations on subdivision and stability of passenger ships (as an equivalent to part B of chapter II of the 1960 SOLAS Convention), London, IMO, 1974. This publication contains IMO resolution A.265 (VIII), A.266 (VIII) and explanatory notes.
- International Maritime Organisation: SOLAS Convention, Consolidated Edition 2009, IMO, London 2009.
- ROROPROB (2000–2003) Probabilistic rules-based optimal design of ro-ro passenger ships, EU Research Project, FP5, DG XII-BRITE.
- Ravn Erik Sonne, Probabilistic Damage Stability of Ro-Ro Ships, Phd Thesis, Technical University of Denmark, Department of Mechanical Engineering, Maritime Engineering, Denmark, Kongens Lyngby 2003.
The stability of a freely floating ship
The PRS Research & Development Division developed theory of calculations of the GZ-curve for a freely floating vessel, available in the report.
Based on this theory, the computer software WinSEA used in PRS for stability calculations has been modified by Dr. Andrzej Laskowski, the author of the program. The user can choose three modes of calculating the GZ-curve: 1) “engineering”, related to the axis Ox’ or Ox”, 2) “physical”, related to the axis Oy or Oy’, and 3) “natural”, related to the z’-axis, identical with the curve of minimum stability. There is also a zero option of “maximum stability”, for a ship with constant trim, normally not used.
The Ox’yz’ system refers to a trimmed unit; it is defined by the PS and waterplane at an initial position. The Ox”y’z’ system is rotated with respect to the Ox’yz’ system around the axis Oz’ by the angle of azimuth y. Both systems are fixed to the unit.
Calculations carried out for conventional ships show that the choice of the reference axis is meaningless. It has, however, some meaning for semi-submersible and jack-up platforms, due to a small ratio L/B, which entails a small difference between longitudinal and transverse stability. In the case of platforms with an initial heel it matters to which side the platform is inclined. If it is inclined in the direction of the initial heel, the GZ-curve exists at the entire range. If it is inclined in the opposite direction, in certain neighborhood of zero the GZ-curve is indefinite due to lack of longitudinal balance. This is due to the small ratio L/B, and more precisely, due to a small ratio of the principal moments of inertia of the waterplane in an upright position Jy/Jx. This problem does not occur on ships without an initial heel – GZ-curves are continuous on both sides.
In the range, where the GZ-curve is indefinite the unit is unstable with respect to the angle of twist, i.e., the ship can automatically rotate by 180° around the axis z’, assuming a heel towards the initial heel, where the ship is stable (it has a positive longitudinal metacentric height) with respect twist. This instability relative to the angle of twist is unfavorable to the safety of the ship.
Sample GZ-curves for three ships and two jack-ups are shown below.
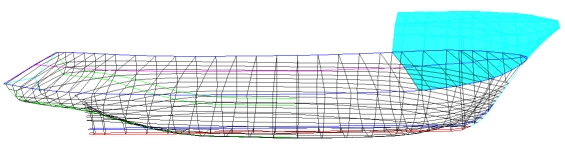 Fig. 1. Body of fishing cutter
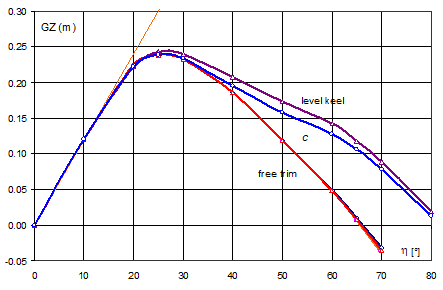
Fig. 2. GZ-curves for the cutter
Curve c in Fig. 2 concerns the constant trim, which occurs at the position of equilibrium.
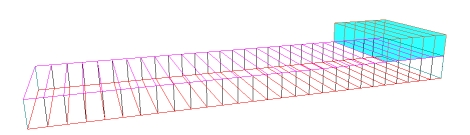
Fig. 3. Barge
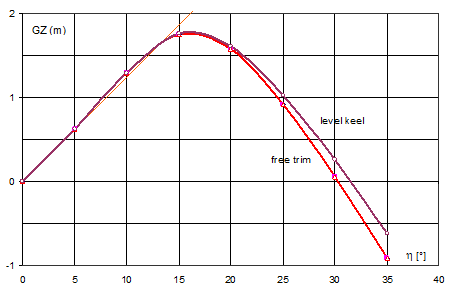
Fig. 4. GZ-curves for the barge
For units without an initial heel, the GZ-curves are anti-symmetric.
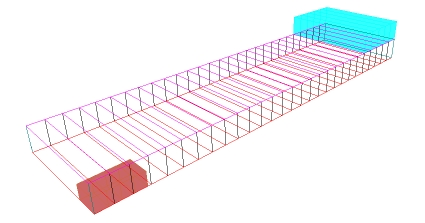
Fig. 5. Barge in damaged condition
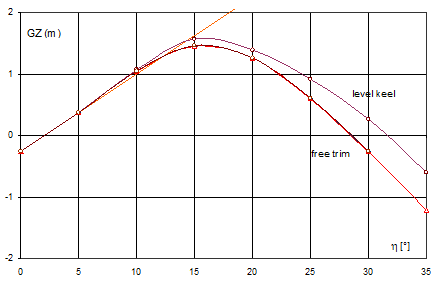
Fig. 6. GZ-curve for damaged barge for heels to starboard (in the direction of initial heel)
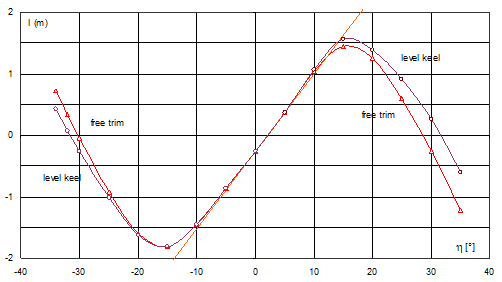
Fig. 7. GZ-curve for damaged barge for inclinations on both sides
For units with an initial heel, the GZ-curves on both sides are different. For the side opposite to the initial heel they are larger, wherein in a certain neighbourhood of zero the GZ-curve of minimum stability does not exist, due to the lack of longitudinal balance. In the case of conventional ships, the interval of discontinuity exists also, but is imperceptible, of the order of angular minutes.
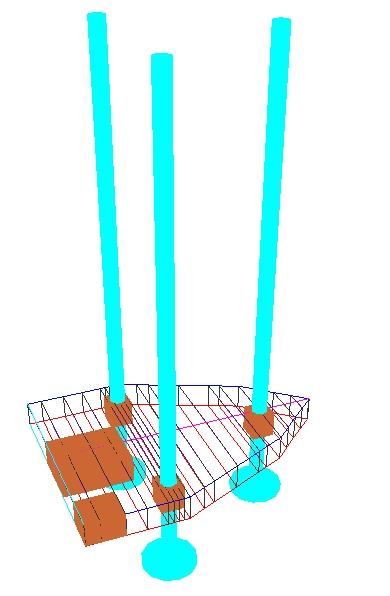
Fig. 8. Jack-up platform I in damaged condition, L/B = 1,36, Jy/Jx = 1,73
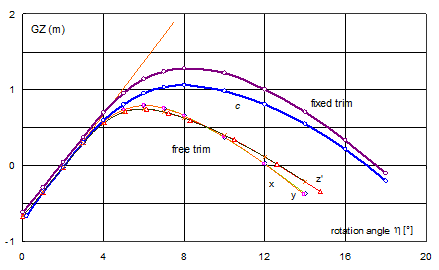
Fig. 9. GZ-curves for platform I inclined to starboard (in the direction of initial heel)
Curve c in Fig. 9 concerns the constant trim, as in the position of equilibrium.
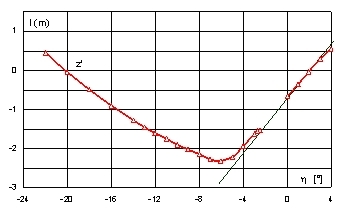
Fig. 10. GZ-curve of minimum stability for platform I inclined to portside
For inclinations to portside, at the range a’ Î á0, -2,5°ñ the GZ-curve does not exist. Outside this range the absolute values of the righting arms are larger, which is better seen in Fig. 12. On the plot summary (Fig. 11, Fig. 12) the discontinuity interval for the GZ-curve of minimum stability (curve z‘) is not well visible.
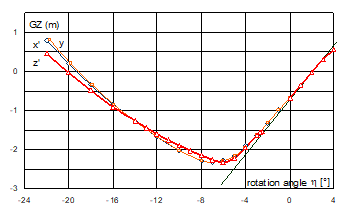
Fig. 11. GZ-curves for platform I inclined to portside
It is noteworthy that the GZ-curve for the reference axes x’ and y almost coincide with each other. This happens in each case, which is well seen on the attached graphs. This comes from the fact the axes of rotation e for these curves are very close to each other. Both curves, however, do not differ much from the curve of minimum stability (curve z’).
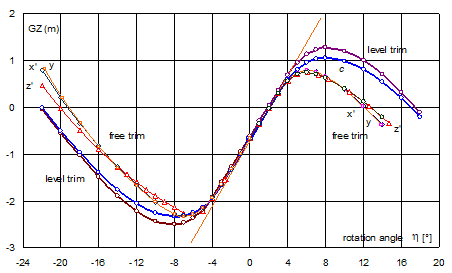
Fig. 12. GZ-curves for platform I for inclinations on both sides
Normally, for a given heel angle the longitudinal balance of the ship occurs at four twist angles (four azimuths), corresponding to transverse inclinations to portside and starboard as well as to longitudinal inclinations (trims) by bow and aft. For the first two twist angles minima of the dynamic arm occur, and for the other – maxima.
In the range, where the GZ-curve does not exist there are only two zeros, corresponding to the minimum and maximum of the dynamic arm ld (Fig. 13). The minimum corresponds to inclination towards the initial heel. The vicinity of the maximum corresponds to instable inclinations with respect to twist angle. It means that the ship will automatically rotate around the axis z’ to the azimuth where the minimum of the dynamic arm ld occurs. For heel angles greater than 2.5°, point B in Fig. 13 will shift to the negative side. Four zeros of the curve le occur then, corresponding alternately to minimum and maximum of the dynamic arm ld.
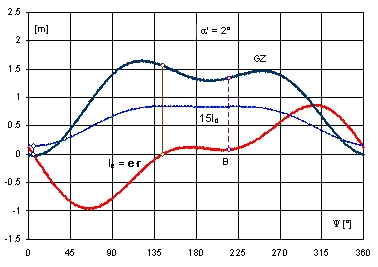
Fig. 13. Run of stability characteristics of rig II in function of twist angle Y for a’ = 2°
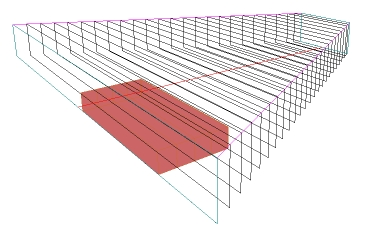
Fig. 14. Jack-up platform II in damaged condition, L/Bmax = 0,805, Jy/Jx = 1,06
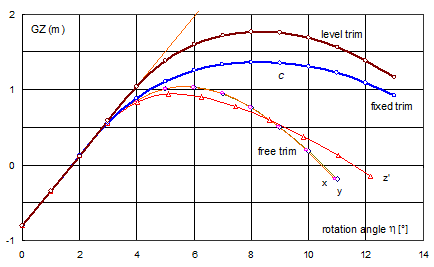
Fig. 15. GZ-curves for platform II inclined to starboard
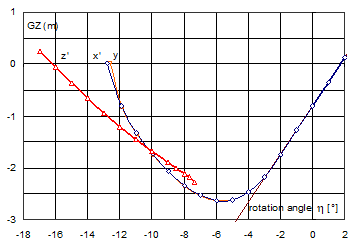
Fig. 16. GZ-curves for platform II inclined to portside
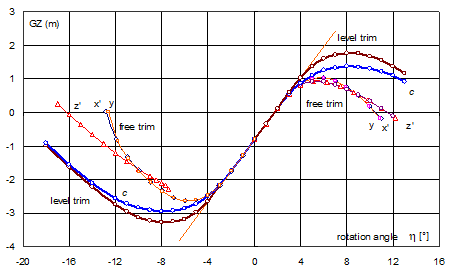
Fig. 17. GZ-curves for platform I for inclinations on both sides
Since the ratio L/Bmax for platform II is smaller than 1, the discontinuity interval for the curve of minimum stability (curve z’) for inclinations to portside is markedly longer than in the previous case, equal to -7,4°, instead of -2,5°. In other words, for inclinations to portside, in the range a’ Î á0, -7,5°ñ the curve of minimum stability does not exist. In turn, for the reference axes Ox’ and Oy the GZ-curve do not exist for heel angles below -13° (Fig. 16, Fig. 17). The said curves are not, however, the curves of minimum stability, though they have the same area between the angle of equilibrium and range of stability, as for the curve z’.
As before, in the range where the GZ-curve does not exist, there are only two zeros corresponding to the minimum and maximum of the dynamic arm ld (Fig. 18).
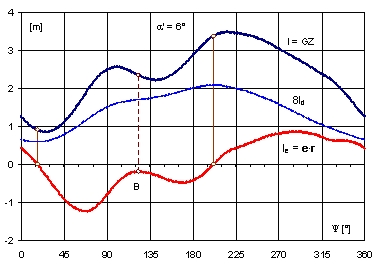
Fig. 18. Run of curves l, ld i le In function of twist angle Y for heel angle a‘ = 6°
Fig. 19 shows the run of stability characteristics for the heel angle a‘ = 6° in function of azimuth for the reference axis Ox”. Identical characteristics are obtained for the reference axis Oy‘. They are different from those for the reference axis Oz’ (Fig. 18). Nonetheless, both indicate on common features – for the given heel angle the minimum and maximum dynamic arms occur at the same twist angles (azimuths).
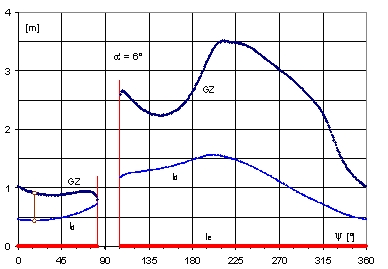
Fig. 19. Run of righting arm l º GZ and dynamic ld for rig II in function of azimuth Y,
for a heel angle less than the critical
From Fig. 19 it follows In addition that for the heel angle a‘ = 6° the platform cannot be longitudinally balance, when the azimuth is from the range y Î á86°, 106°ñ.
A few further conclusions can be drawn from the above calculations:
- at the initial range of stability all modes of calculations (including the fixed trim) yield practically the same results
- the choice of the reference axis is practically meaningless. It affects only the way the ship is balanced, without changing the direction of the righting moment, nor the area under the GZ-curve, which is the lowest possible. This is a feature of a freely floating unit
- for a ship with an initial heel, in a certain neighborhood of zero for inclinations on the opposite side, dependent on the ratio L/B, the GZ-curve cannot be obtained, due to lack of longitudinal balance
- for a freely floating ship only one GZ-curve is meaningful, related to transverse inclinations about the principal axis of inertia for an upright waterplane. For other azimuths, the GZ-curves have intervals in which they do not exist.
For ships there is no revolution – any method of calculating the GZ-curve with free trim yields virtually the same curve. However, there is a revolutionary conclusion for platforms – there is only one GZ-curve related to the reference axis Oz’. In other words, for rigs GZ-curves for various azimuths do not exist, nonetheless the regulations require such calculations.
The PRS Research & Development Division developed software analysis for bulk carrier and tanker structure strength under the load cases defined in Common Structural Rules for Bulk Carriers and Common Structural Rules for Double Hull Oil Tankers. The Program supports surveyor’s work in calculating module zone strength using FEM for load cases automatically launched to the module.
Sample load distribution calculated with the software for Alternate Load and Alt Block Load for the middle bulk carrier module is shown below.
 | 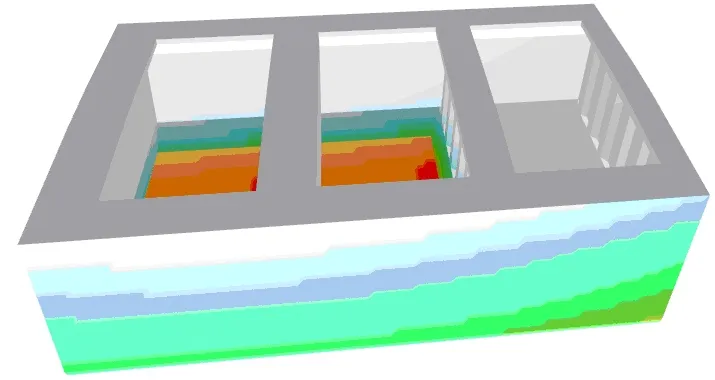 |
Fig. 1 Pressure distribution for Alternate Load – F2 and Alt-Block Load – H1
Load distribution allows for the analysis of stresses in the elements of the subject ship hull module. The figures below illustrate reduced stress distribution for the given loads and the extent of the structure deformations. (deformations multiplied 50 fold to the figure scale).
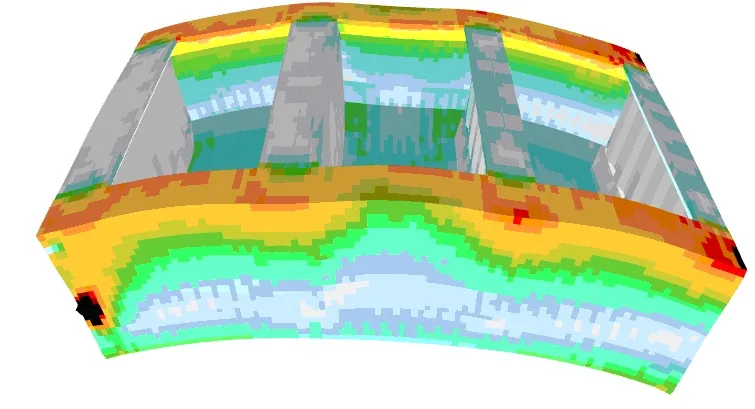 | 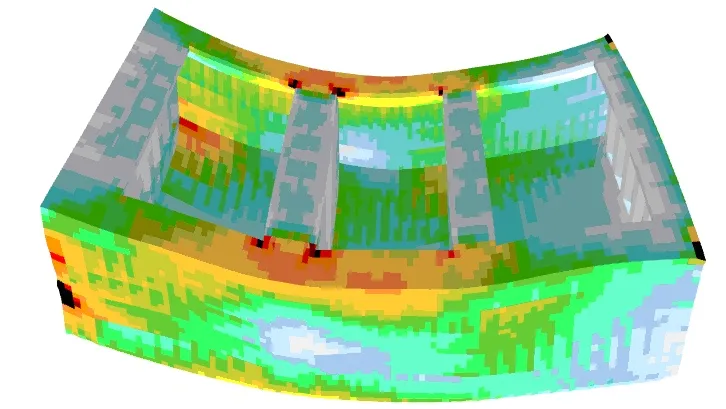 |
Fig. 2 Reduced stress distribution for Alternate Load – F2 (hogging) and Alt-Block Load – H1 (sagging)
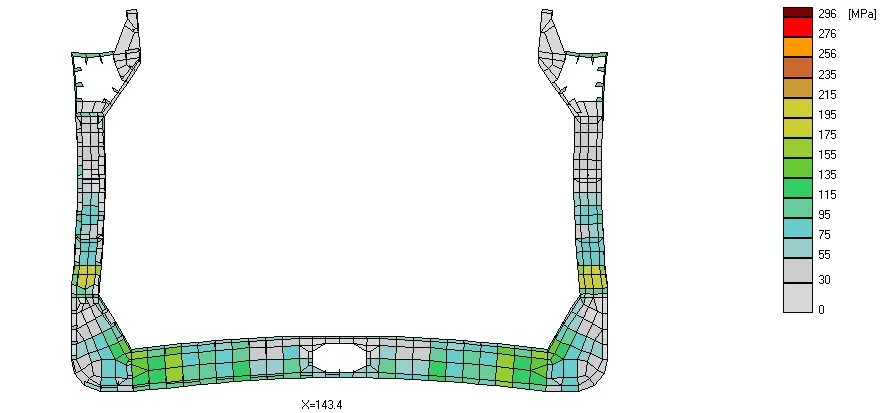
Fig. 3 Stress distribution in frame cross section
Wave loads
Developed procedures for automatic launch of loads to the finite element modelling of the hull module give a possibility for computing ship structure response to real ship structure loads in any waving conditions. These loads embrace, among others, the cargo gravitation generated loads and inertia related loads generated by ship motion in waves, wave generated loads on wetted ship surfaces, etc. Stress calculations are made in time domain. The figures below illustrate the wave pressure distribution changing in time, the structure displacement caused by the loads.
 |  |  |
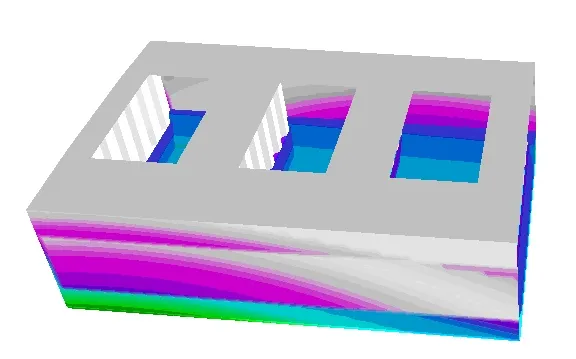 | 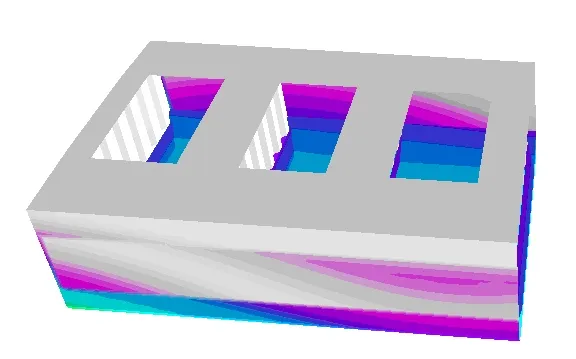 | 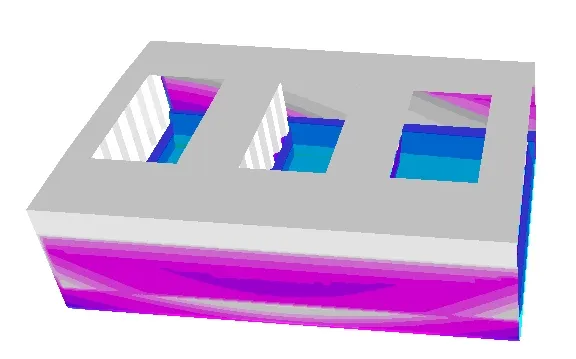 |
Fig. 4 Wave pressure distribution for t=0, t=1/5T,…., t=T
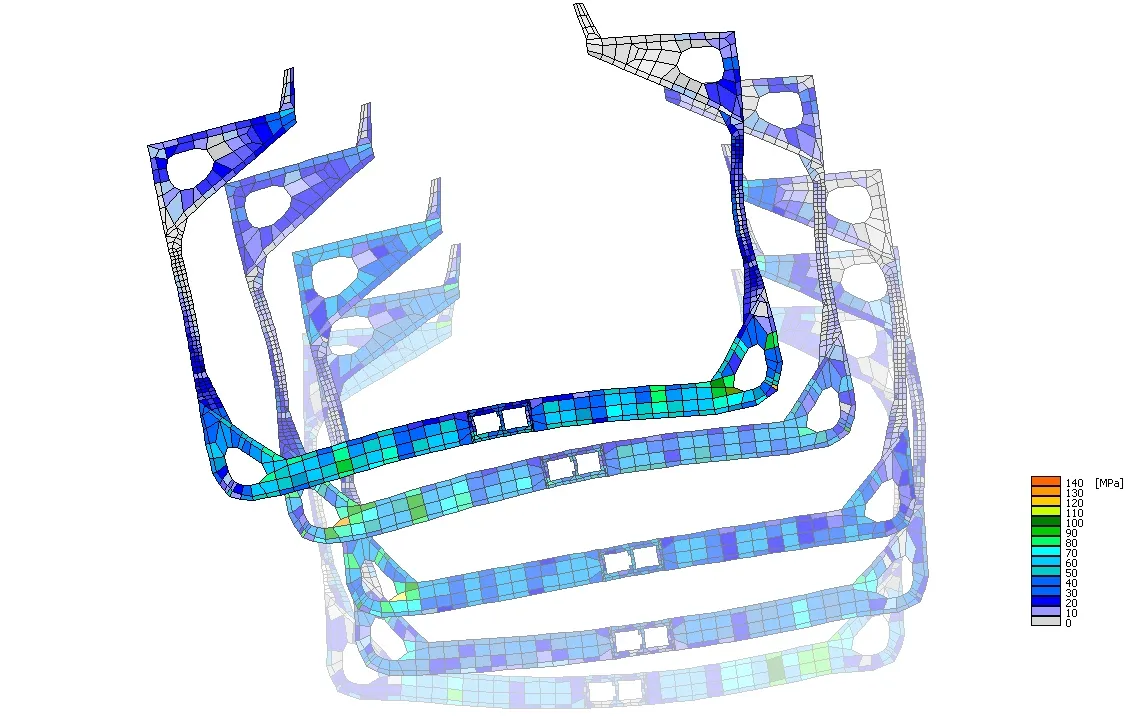
Fig. 5 Change in structure element displacement and stress distribution in frame cross section caused by structure module wave loads in time domain
Predicting stress in ship hull structure
The final software product serves to perform long-term predictions of ship behaviour in waves and an analysis of stresses for the ship’s life period. The so-called coefficient method was applied to predict stresses in the structure. The method involves division of hull structure into panels (bigger than finite elements), application of unit loads and calculation of the unit load impact on stress of structure elements examined.
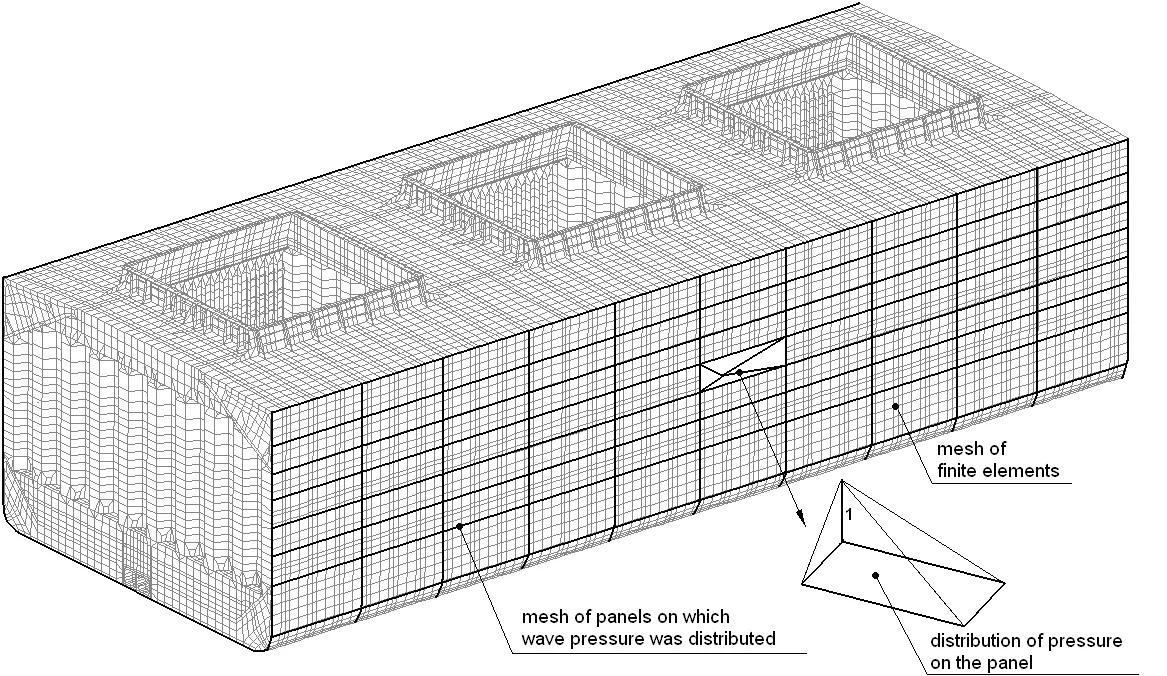
Fig. 6 Mesh of elements applied in the impact coefficient method
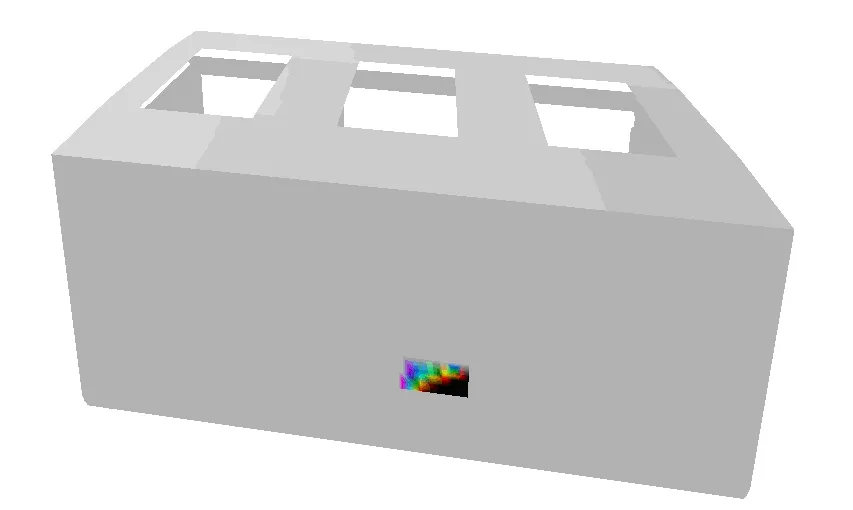 | 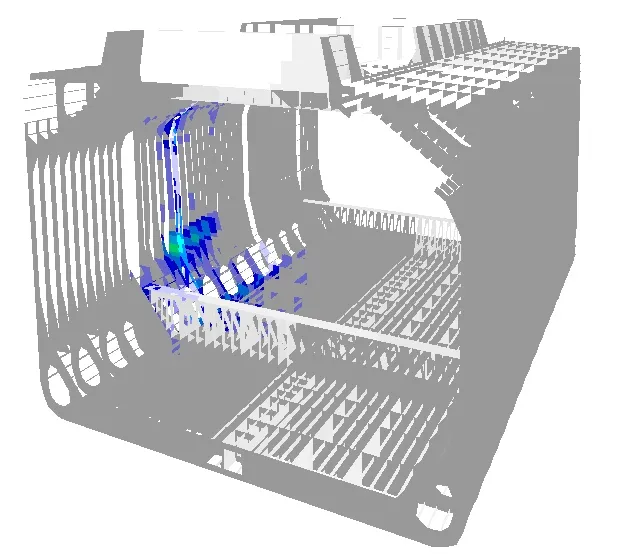 |
Fig. 7 Distribution of unit pressure on a selected element of the shell plating and its response, in form of structure stress distribution, to this unit pressure
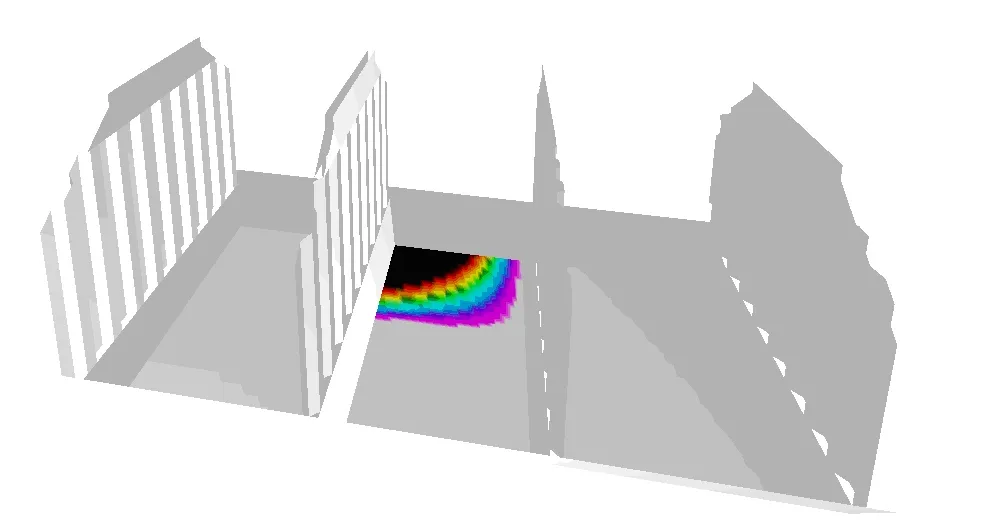 | 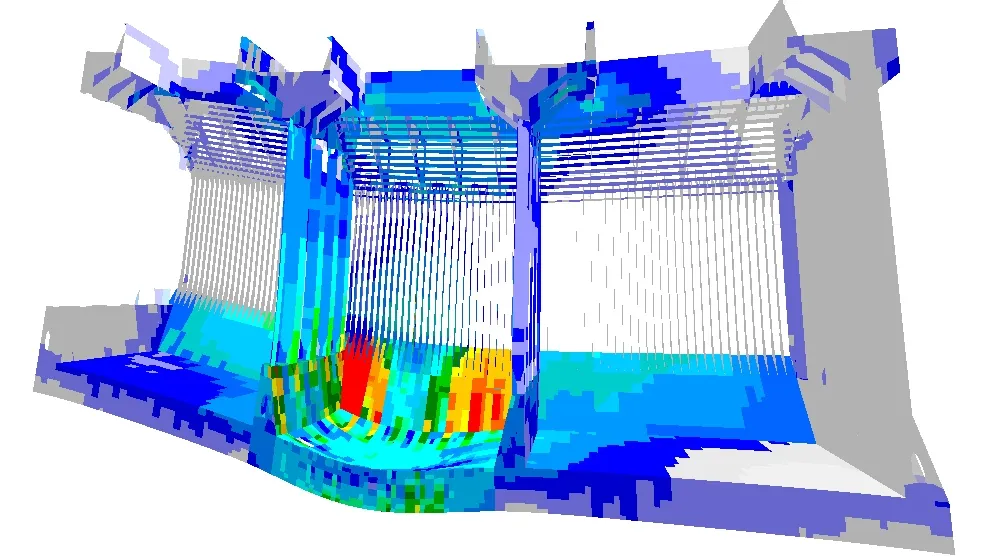 |
Fig. 8 Distribution of unit pressure in a selected structure element and its impact on stress distribution in the structure
Stress simulation in various sea states provides the option to develop the probability density function of stresses in particular ship structure elements. Sample distributions are shown in the figures below..
|
|
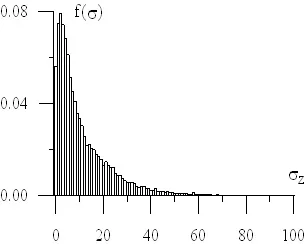
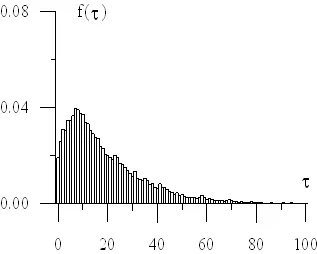
Fig. 9 Reduced and tangent stress probability density function in the examined
